Cold Email Open Rate Benchmarks by Industry and Sequence Step
Apple Mail Privacy Protection and AI inbox agents inflate open rates by 15-plus points.

Search for cold email open rate benchmarks in 2026 and the numbers refuse to agree with each other. One source puts the B2B average at 15.1%, another at 55.71%, and both claim to describe the same thing. That 40-point spread is not a sign that someone's data collection is sloppy. It comes from a measurement architecture problem: two tracking distortions that compound on top of each other and inflate what dashboards report as a human open.
The first distortion is Apple Mail Privacy Protection. Stripo's 2026 research report finds that MPP now drives roughly half of all tracked B2B email opens, 49.29% by its count, through automatic pixel pre-loading that has nothing to do with whether a person ever looked at the message. Apple's proxy servers fetch the tracking pixel the moment an email arrives, before any human touches it, and that fetch logs as an open indistinguishable from a real one in every email service provider's dashboard. The second distortion layers on top of the first: AI inbox agents, including Gemini and similar tools, pre-render email content on a user's behalf, sometimes through cloud infrastructure. That pre-rendering fires the pixel again, and no filter built so far can tell that machine-generated open apart from a genuine human read. Corporate security scanners add a third layer on enterprise-targeted campaigns, pre-scanning inbound mail for malware and logging a bot open as a human one in the process, a pattern EmailBison's 2026 benchmark guide documents directly.
Stripo's report estimates that stacking all three together produces an inflation range of 15 to 20-plus points for a typical B2B list. A campaign showing a strong open rate on paper may reflect real human engagement far below what the dashboard displays. Part of the disagreement between benchmark sources also comes down to what they are actually measuring. Stripo's 2026 report separates three categories that all get labeled "B2B average open rate" despite describing different things: newsletter engagement, sales emails sent to a mix of cold, warm, and existing customers, and cold outreach aimed strictly at net-new prospects. Each category carries a different level of MPP contamination, and each draws from a different audience mix, with SMB-heavy lists running meaningfully higher than enterprise-heavy ones. Comparing a newsletter benchmark to a cold outreach number was never a fair comparison to begin with, and the 40-point spread reflects that mismatch as much as it reflects tracking noise.
Google and Yahoo's 2024 Authentication Mandates and Achievable Benchmarks
Benchmarks from before 2024 are no longer usable as reference points for most senders, because the infrastructure required to reach any benchmark changed that year. Starting in February 2024, Google and Yahoo made SPF, DKIM, and a minimum DMARC policy of p=none mandatory for bulk senders, a shift both EmailBison's 2026 guide and Instantly's 2026 benchmark report confirm. Senders who fail to meet those requirements are not simply routed to spam anymore. Their mail gets rejected.
That changes what counts as a baseline before a single subject line gets tested. Domain warm-up and rotation across multiple sending mailboxes are not optimizations layered on top of a good campaign; they are prerequisites for reaching the open and reply rates reported in any 2026 benchmark. A team sending from a cold, unrotated domain is not competing in the same game as the campaigns that produced those numbers, regardless of how sharp its copy is.
This matters because it changes how a team should read a disappointing open rate. A team that sees its own open rate sitting well under the published average often assumes the problem is the subject line or the targeting. Often the problem is that the email never reached an inbox where a human could decide whether to open it. Tracking pixels make this worse in a quieter way. EmailBison's 2026 guide notes that the HTML an open-tracking pixel adds to an email raises its spam-filter score, and recommends against using open tracking on cold outreach for that reason alone. The benchmarks discussed in the rest of this piece assume a sender's infrastructure is already in order: authenticated domains, a warmed sending history, and rotation across mailboxes. Readers whose infrastructure isn't there yet should treat that as the first problem to fix, well before comparing a specific open rate figure to an industry number.
What open rate measures in 2026
Open rate in 2026 still tells you something real, just not the thing most people use it for. It remains a dependable way to catch deliverability breakage, but it has stopped being a trustworthy measure of human engagement. That role now belongs to reply rate.
EmailBison's 2026 benchmark guide draws the distinction cleanly: a reply requires an actual human to read a message, think of something to say, and send it back. No bot triggers that sequence, no privacy feature fakes it, and no pixel fires a false positive reply. Open rate can't make that claim anymore. Its legitimate use case has narrowed to detecting sudden drops of 10 or more points, which signal a deliverability problem such as a domain landing on a blacklist or mail routing into spam, a different cause than a weak subject line. Stripo's 2026 report recommends click-to-open rate and reply rate as the engagement metrics to track instead, since neither one is distorted by MPP.
The tracking pixel itself may be quietly working against the sender. Snov.io's analysis of more than 44 million emails found that turning off open tracking more than doubled reply rates in its dataset, a result that points to the pixel degrading deliverability enough to suppress the very replies practitioners are trying to generate. Instantly's 2026 benchmark report states the diagnostic: a high open rate paired with a low reply rate means the email landed in Promotions or the copy failed to land, and open rate alone cannot tell you which. Total reply rate counts every response, including opt-outs and out-of-office auto-replies, while positive reply rate counts only meeting requests, qualification questions, and other signals of real interest. A benchmark that doesn't specify which one it's reporting is only half useful. Instantly's 2026 report puts the overall average cold email reply rate at a low figure, with elite campaigns reaching well into double digits and the top quartile meaningfully outperforming the norm.
With that interpretive frame in place, the industry benchmarks below become usable.
Open and reply rate benchmarks by industry
Industry is the single strongest predictor of cold email open rate, and the gap between verticals is not statistical noise. It reflects genuine structural differences in how crowded an inbox is, how aggressively a spam filter treats a given sender category, and how recipients in that field tend to behave toward unsolicited mail. Snov.io's 2026 report and Cleverly's 2026 benchmark guide both land on a consistent overall B2B average open rate, but that number is only a starting point. The industry-specific figures are what a team should actually measure itself against.
| Vertical | Open rate performance | Structural driver | |---|---|---| | Religious organizations | Highest average, per Instantly's 2026 report | Mission-driven messaging, less crowded inboxes | | Nonprofits | Among the highest averages, per Instantly's 2026 report | Similar low-saturation, mission-aligned context | | Energy management | Well above average, per Instantly's 2026 report | Technical relevance, lower inbox saturation | | Recruiting / staffing | High, driven by inherent personal relevance | Job-related email carries curiosity even when unsolicited | | Consulting | Strong, per Instantly's 2026 report | Mid-range inbox competition | | B2B SaaS | Below average, per Instantly's 2026 report | Crowded inboxes, aggressive spam filtering | | Financial services | Below average, per Instantly's 2026 report | Aggressive spam filtering |
Each figure in that table traces back to a cause, not a coincidence. Religious organizations and nonprofits post high opens because the messaging is mission-driven and the inboxes receiving it are less saturated with competing cold outreach than a typical corporate inbox. Energy management benefits from the same lower saturation while also carrying more technical relevance to its recipients. Recruiting and staffing emails succeed for a simpler reason: a job-related message carries built-in curiosity even when the recipient never asked for it. B2B SaaS and financial services sit at the other end for the opposite reason. Both categories flood inboxes with cold outreach, and both get treated more aggressively by spam filters as a result, which suppresses open rates even for campaigns with excellent copy and tight targeting. A SaaS team that posts an open rate well above its industry's norm is genuinely beating the field, not just benefiting from an easy category.
A mismatch between open rate rankings and reply rate rankings by industry marks the more revealing pattern. A vertical can rank low on opens and still rank high on replies, and that divergence is the clearest argument for treating open rate as a directional signal. If opens and replies always moved together, there would be little reason to track both. They don't, and that gap is what a sender needs to watch.
How open and reply rates shift across sequence steps
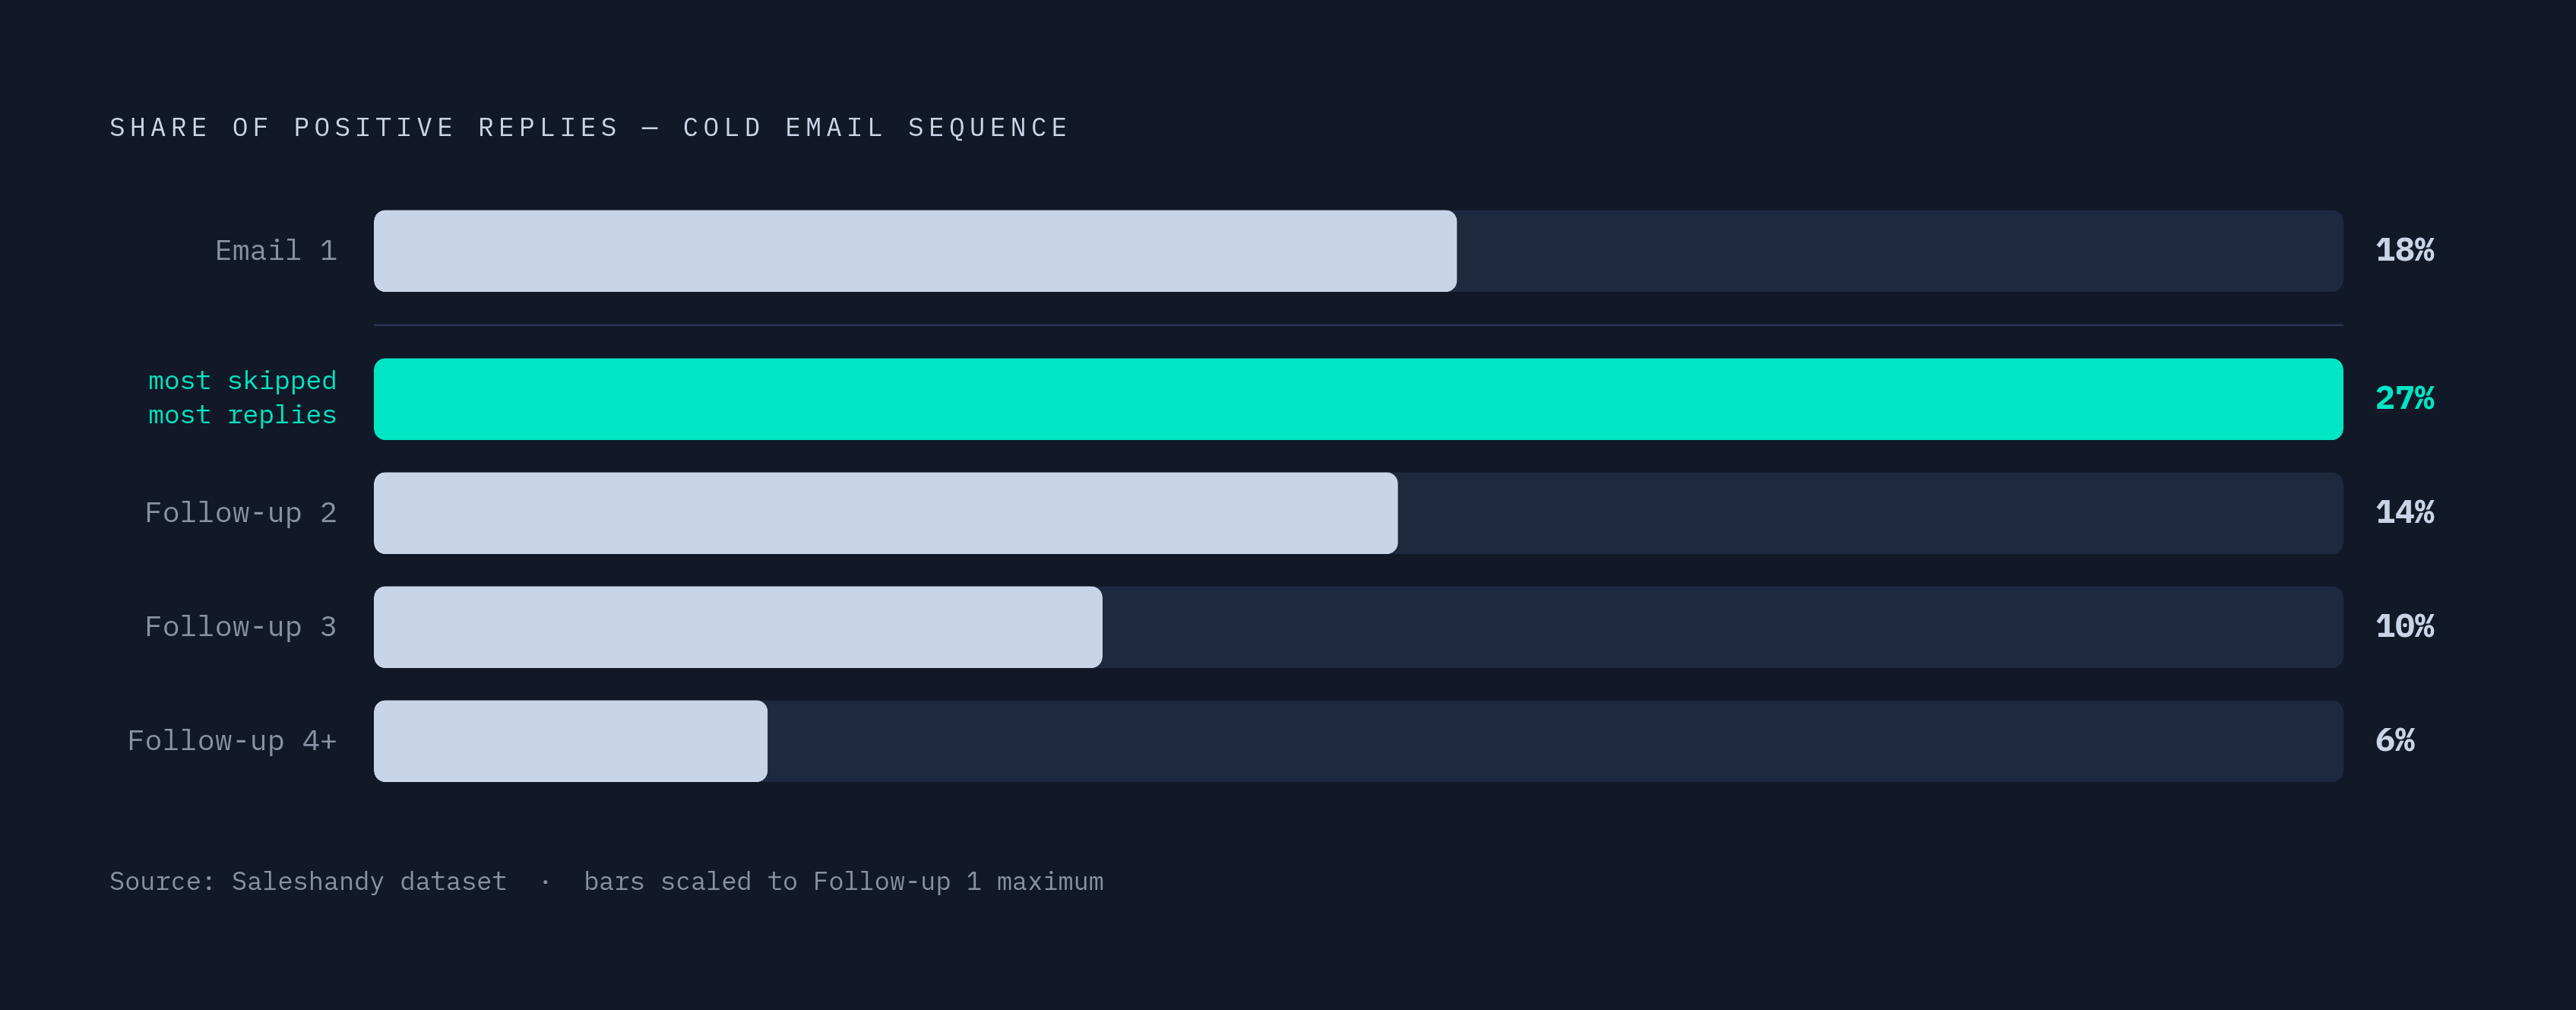
The first email in a sequence sets a ceiling on how much attention a campaign can get, but it is not where most of the pipeline gets built. Saleshandy's analysis of sequence-step data found that the first follow-up alone generated more than a quarter of all positive replies in its dataset, making it the single most valuable message in the entire sequence after the initial send. That number should reshape how teams allocate their effort, because most of them are still pouring nearly all their optimization energy into the first email and treating the follow-up as an afterthought.
Later steps still contribute, just with returns that shrink as the sequence goes on. Follow-up two and follow-up three add more positive replies on top of what the first follow-up generates, but the cumulative reply curve flattens out after the third or fourth touchpoint; a fifth or sixth message rarely earns its keep.
The gap between what the data shows and what reps actually do is stark. A significant share of sales reps never send a single follow-up after an unanswered first message, and a further substantial share give up after just one attempt. That means most practitioners are abandoning their sequences at precisely the step the data identifies as the richest source of replies. Open rate behavior across the sequence reinforces this. First emails get the highest opens of any step, but follow-ups tend to convert opens into replies at a higher rate, because the audience still reading them has already self-selected: these are people who opened the first message and chose not to act on it. That self-selection means a follow-up should never just repeat the original pitch. It should address, directly, why the recipient didn't respond the first time.
A short, two-email sequence can post a higher reply rate per email than a longer one, since the first message typically draws the best response of the whole sequence. But per-email rate was never the right scoreboard. Booked meetings are the goal, and booked meetings accumulate across every step in the sequence, including the ones with a lower per-email conversion rate. A sequence that stops after one follow-up is leaving the most productive email in the whole structure unsent.
How infrastructure, audience, and tracking setup change open rates
For most teams, the industry and sequence-step benchmarks above only mean something if the comparison underneath them is apples to apples, and that comparison is rarely apples to apples. The same email, sent to the same list, can produce wildly different open rates depending on domain warm-up status, inbox rotation, and the state of a team's deliverability infrastructure. EmailBison's 2026 guide notes that the deliverability floor for senders who don't meet current authentication requirements has dropped sharply since 2024. Two teams running identical copy to identical audiences can land in entirely different places if one has its infrastructure in order and the other doesn't.
Audience composition matters just as much, and it's the variable most teams overlook. Stripo's 2026 report finds that North American, Apple-heavy lists inflate open rates higher than European, non-Apple-heavy lists do, because MPP's impact scales with how much of a list reads mail through Apple's ecosystem. A team selling into US tech companies is working against a very different MPP exposure than a team selling into German manufacturing firms, and comparing their raw open rates side by side tells you more about their audience's mail client than about the quality of either campaign.
Instantly's 2026 benchmark report lays out a diagnostic framework for drawing any conclusion from a number. A sudden drop of 10 or more points in open rate signals a deliverability problem. A stable but low open rate paired with a normal reply rate points to a subject-line or targeting issue. A high open rate paired with a very low reply rate usually means the email is landing in the Promotions tab or the copy itself isn't landing. Platforms built around inbox rotation, automated warm-up, and smart sending windows, including Snov.io, Autobound, and Amplemarket, exist to help senders reach the benchmark ranges this piece has laid out rather than the deflated figures that come from under-configured campaigns. Both Snov.io's platform data and Instantly's 2026 report treat that kind of infrastructure as a prerequisite for competitive performance, not a nice-to-have.
One gap remains unresolved across the industry. No benchmark study to date has accounted for AI agents summarizing email on a user's behalf, and no MPP-filtering technique currently separates that kind of machine-generated open from a human one. Any 2026 benchmark that doesn't address this is already somewhat overstated, and the gap will widen as AI inbox adoption grows.
A benchmark number is only useful once a sender knows four things about its own setup: whether the ESP filters out MPP-driven machine opens, what share of the list reads mail through Apple, whether the sending infrastructure is fully authenticated and properly warmed, and whether the benchmark being used was built from cold outreach data or newsletter or marketing email figures. Open rate remains a useful instrument for catching a deliverability problem the moment it happens. It was never built to tell you whether a human being, on the other end of that message, decided your email was worth answering.